Nonprofit fundraising statistics and trends are essential for making data-driven decisions, especially in a constantly changing philanthropic space. By understanding recent insights, you’ll be able to identify areas for improvement and refine your strategies. We’ve rounded up a few essential resources to set your team up for success.
The Biggest Takeaway: Across all the categories of fundraising statistics that we’ve examined, it’s clear that nonprofits of all sizes routinely leave a lot of potential revenue on the table. As philanthropic giving continues to grow, organizations should prepare to pursue new opportunities as they emerge. It can be beneficial to take into account demographic changes, growth in corporate giving trends, and the dominance of mobile web browsing when developing updated fundraising strategies in the coming years.
Fundraising Statistics:
Macro Market Trends & Total Sector Giving
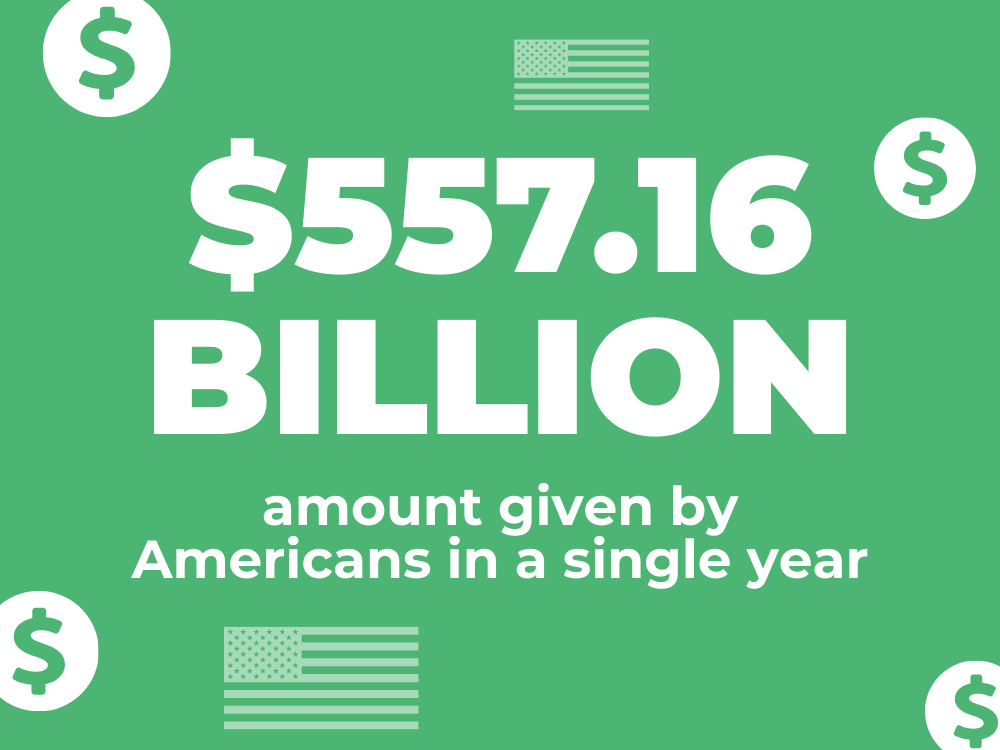
- Americans give an estimated $557.16 billion to charity each year.
- The largest source of giving comes from individuals, who contributed over $374.40 billion (representing 67% of total giving).
- According to new 2026 research from Double the Donation, 65.8% of nonprofits receive fewer than 500,000 individual contributions each year.
- Around 18.6% of total nonprofit giving comes from foundations, totaling approximately $103.53 billion each year.
- The majority of charitable dollars went to the following sectors: religion (27%), human services (14%), education (13%), grantmaking foundations (11%), and health (10%).
- 6 out of 9 nonprofit subsectors continue to exceed pre-pandemic giving levels, even when adjusted for heightened levels of inflation.
- 57% of donors are enrolled in a recurring giving program, up from 46% the previous year.
- The average one-time gift jumped to $121, up from $115 the previous year.
- More than 9% of total donors participate in a workplace giving program (such as matching gifts and/or payroll donations).
- It can cost up to $1.50 to raise a single dollar from a new donor, while soliciting from existing donors typically costs $0.20 or less.
- 17-33% of all annual giving happens in December each year.
A breakdown of nonprofits surveyed for this fundraising research:
of fundraising professionals self-reported as working for a ‘micro’ nonprofit.
of fundraising professionals self-reported as working for a ‘small’ nonprofit.
of fundraising professionals self-reported as working for a ‘mid-sized’ nonprofit.
of fundraising professionals self-reported as working for a ‘large’ nonprofit.
of fundraising professionals self-reported as working for an ‘enterprise’ nonprofit.
The Takeaway: Donation revenue and interest in philanthropy continue to grow across the board for organizations of all shapes and sizes. Still, it’s essential that nonprofits prepare to adapt their strategies to shifting trends and sector-wide developments.
Fundraising Statistics:
Online Donations and Mobile Giving
- While revenue from one-time online giving decreased by 12%, revenue from monthly giving increased by 11% and accounted for 28% of all online giving.
- 94% of recurring donors prefer to give monthly, 3% weekly, 2% annually, and 1% quarterly.
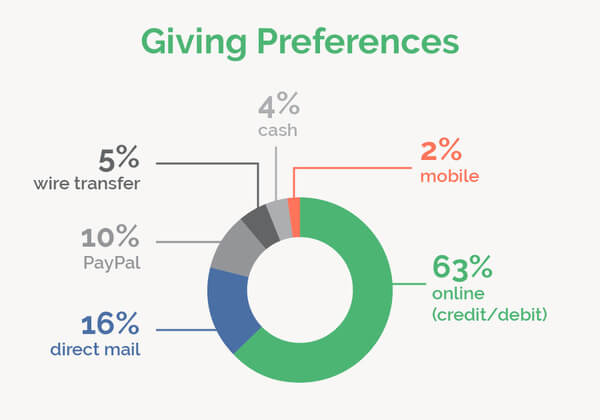
- 63% of donors prefer to give online with a credit or debit card, followed by direct mail (16%), PayPal (10%), wire transfer (5%), cash (4%), digital wallet (1%), and text-to-give (1%).
- 10% of US and Canadian donors participate in peer-to-peer fundraising efforts benefiting nonprofit organizations.
- 34% of donors contribute to nonprofit crowdfunding campaigns.
- 47% of donors also support nonprofit causes through online raffles or sweepstakes, 45% purchase from an online store benefiting a nonprofit, and 24% give through online auctions.
- 38% of online donors who make a gift in one year contribute to that nonprofit again the following year.
- Nearly 42% of nonprofits cited online campaigns as the most effective at generating high levels of matching gift conversions.
Mobile Fundraising Statistics:
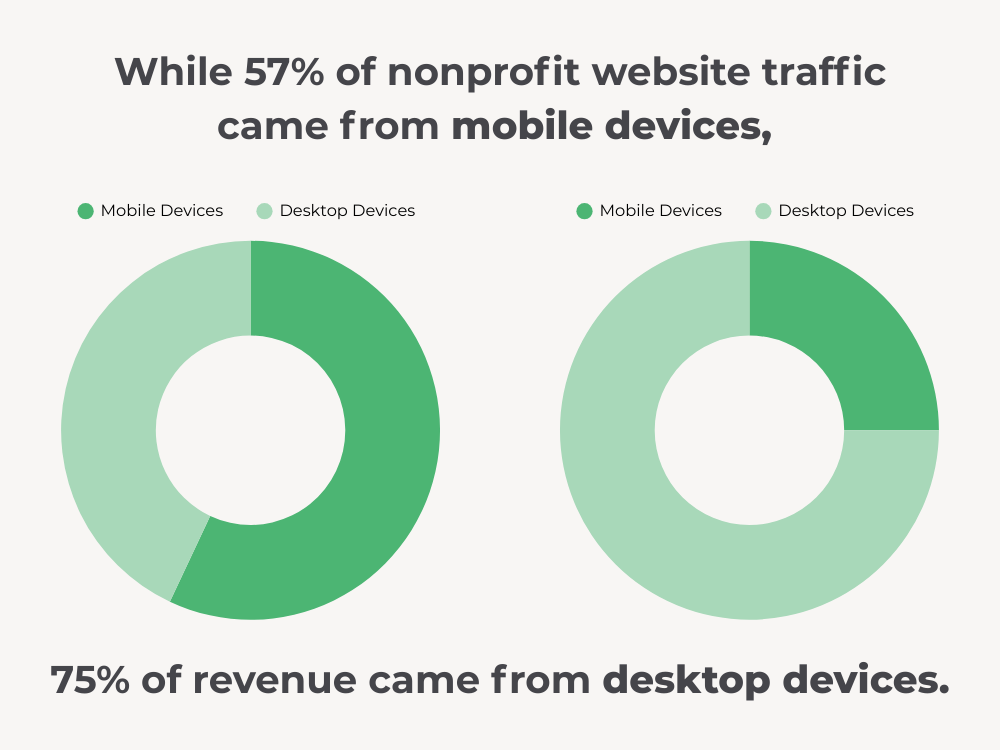
- While 57% of nonprofit website traffic came from mobile devices, 75% of revenue came from desktop devices.
- Online donation pages had an average conversion rate of 8% on mobile devices last year, but the number of transactions completed through mobile devices increased by 50%.
- The average gift by mobile users is $79, while tablet users give $96, and desktop users give $118.
The Takeaway: Online fundraising has become increasingly important to nonprofits across the board, with digital donor retention now slightly easier to maintain as supporters warm to monthly recurring donation options.
Meanwhile, mobile fundraising and mobile-optimized donation pages are more crucial than ever, but securing mobile donations is generally less effective than on traditional desktop browsers.
Fundraising Statistics:
Corporate Philanthropy & Workplace Giving
- In recent years, giving has increased by more than 15% for 6 out of 10 companies.
- Corporations gave more than $21.08 billion to nonprofits, an increase of 3.4% over the previous year.
- The top 10 most generous corporations donate over $2 billion annually to nonprofits, much of it through employee matching gift programs.
- 65% of companies surveyed provide employees with paid-release time volunteer programs.
- In the last three years, Russell 1000 companies offering unrestricted programs (meaning they will match gifts to any nonprofit) grew by 48%, whereas those with restricted programs (meaning they will only match gifts to specific nonprofits, such as those in higher education) decreased by 33% to 13.6%.
- Microsoft is the largest contributor of corporate philanthropy funds, with a 65% employee participation rate for annual giving campaigns.
- Only 19% of companies include more than one paragraph on their matching gift programs in easily accessible employee-facing materials, leading many eligible donors to be unaware of program guidelines and/or participation.
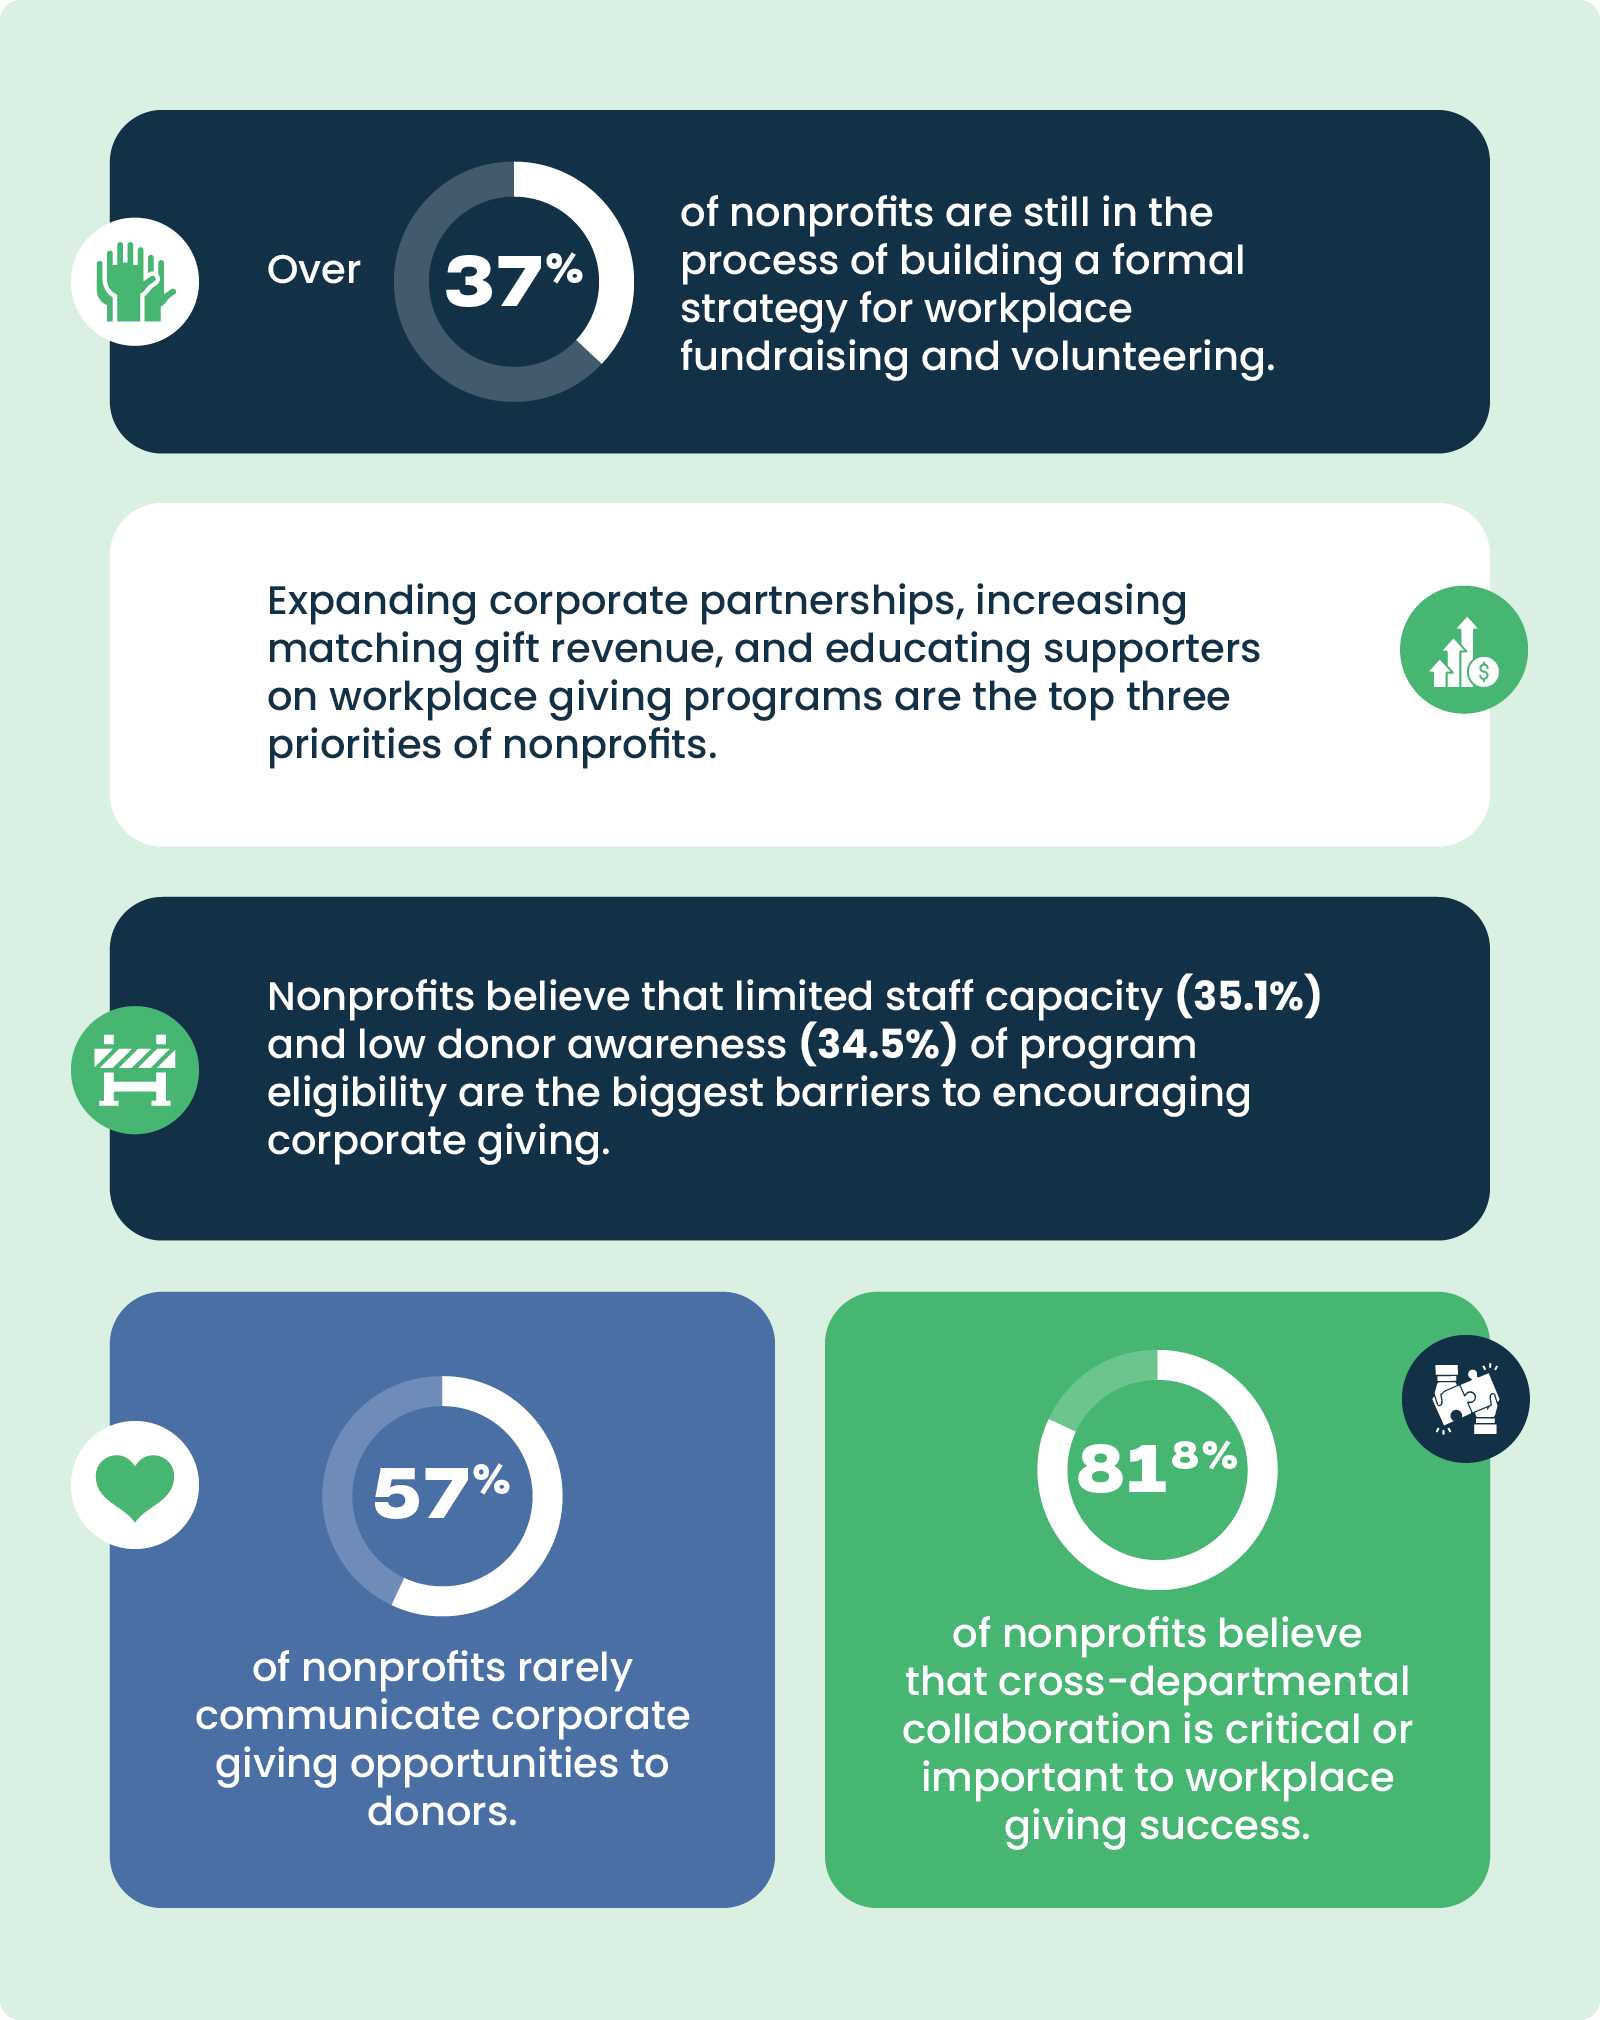
- Over 37% of nonprofits are still in the process of building a formal strategy for workplace fundraising and volunteering.
- Expanding corporate partnerships, increasing matching gift revenue, and educating supporters on workplace giving programs are the top three priorities of nonprofits.
- Nonprofits believe that limited staff capacity (35.1%) and low donor awareness (34.5%) of program eligibility are the biggest barriers to encouraging corporate giving.
- 57% of nonprofits rarely communicate corporate giving opportunities to donors.
- Only 12% of nonprofit professionals are very confident in their knowledge of corporate giving opportunities.
- More than 50% of nonprofits lack a dedicated workplace giving team.
- Over 50% of nonprofits consider their workplace giving strategy to be informal or ad-hoc.
- 81.8% of nonprofits believe that cross-departmental collaboration is critical or important to workplace giving success.
- Two-thirds of organizations report a lack of a formal process for identifying new corporate partners due to manual tasks.
Matching Gift Fundraising Statistics:
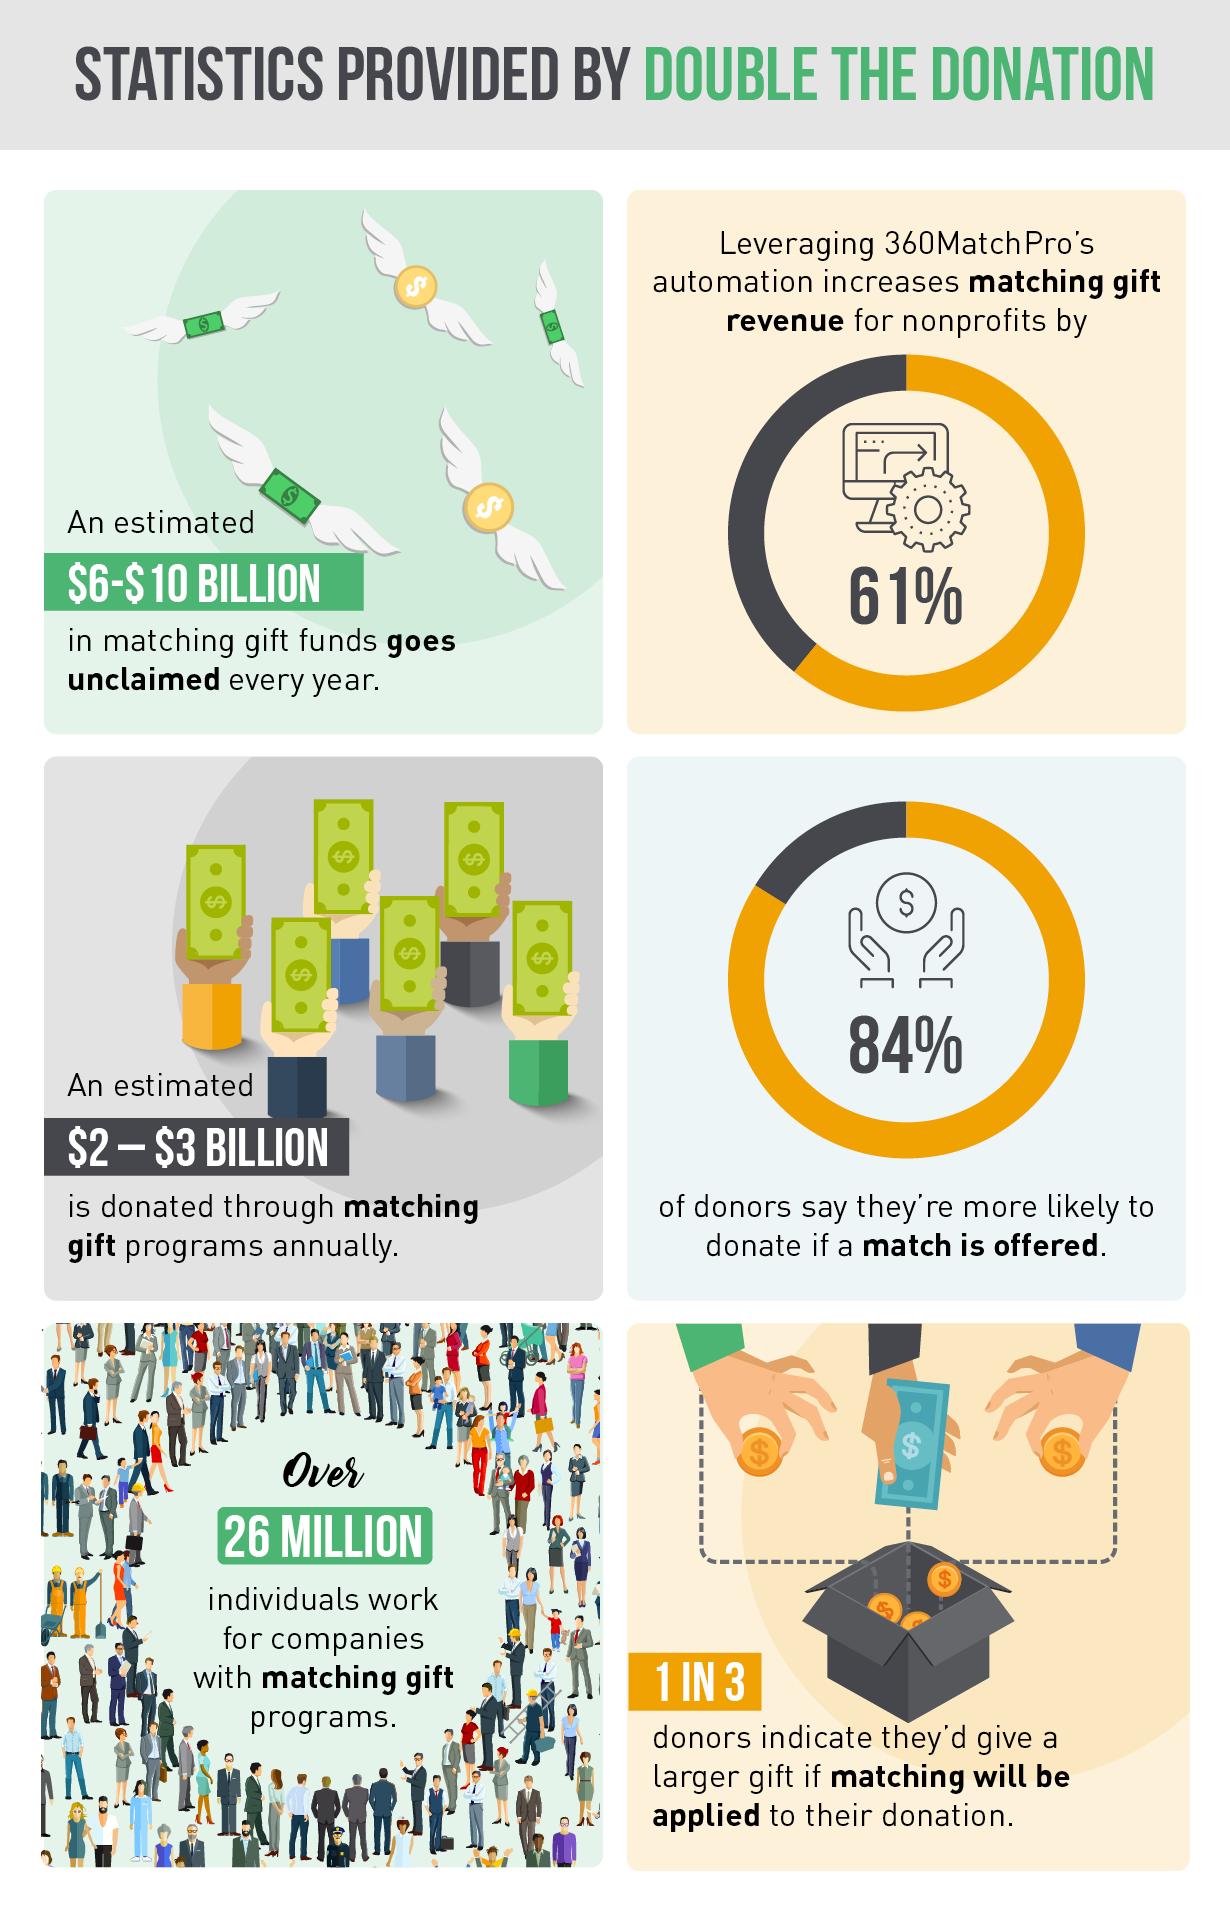
- Roughly $2–$3 billion is donated through matching gift programs annually.
- However, an estimated $6–$10 billion in matching gift funds goes unclaimed every year.
- More than 26 million individuals work for companies with matching gift programs, but over 78% of this group are unaware that their company offers a matching gift program or know any program specifics.
- 84% of donors say they’re more likely to donate if a match is offered.
- Over the last three years, the percentage of Russell 1000 companies reporting that they offer employee matching gifts grew by 11.8% to 51% total (with more companies offering the programs but not yet publicly disclosing them).
- 12% of total corporate cash donations to nonprofits are made through matching gift programs.
- 1 in 3 donors say they’d give a larger gift if they knew it would be matched and doubled.
- Only 1.31% of individual contributions made to the average nonprofit are matched, despite an estimated 10% being eligible.
- 96% of employees strongly prefer for their company to match donations made directly to a nonprofit rather than only matching donations through a workplace giving software platform.
- Leveraging Double the Donation’s matching gift automation increases matching gift revenue for nonprofits by 61%.
- The addition of auto-submission functionality is projected to yield an 80% increase in matching gift revenue for organizations that use it.
The Takeaway: Corporate philanthropy, specifically matching gift programs, represents a major missed opportunity for most nonprofits. Donors are more than willing to increase their support when they know it can be matched by their employers, and companies are happy to offer their employees these options to streamline philanthropic outreach.
Recent workplace giving trends show the potential impact of matching gifts is significant, but low awareness is the largest hurdle. Nonprofits should prioritize promoting these programs to donors to see more results.
Fundraising Statistics:
Donor Motivations & Conversion Triggers
- The average donor in the United States is 64 years old and makes two charitable gifts a year.
- 33% of donors give to organizations located outside of their country of residence.
- 67% of US and Canadian donors are female, while 32% are male, and 1% identify as non-binary.
- Female donors are more likely to donate due to social media marketing, while male donors are more likely to give in response to email messages.
- 81% of donors contribute food or other goods to nonprofits through in-kind donations.
- 48.5% of nonprofit professionals say they mention matching gifts as a “bonus” in their donation appeals.
- 18.2% of nonprofit professionals say they use matching gifts to establish a sense of urgency within donation appeals to reach a specific goal.
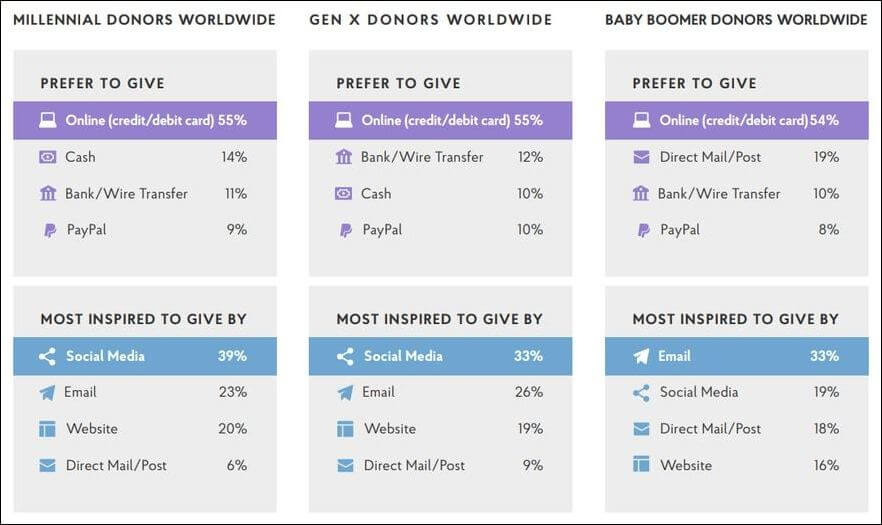
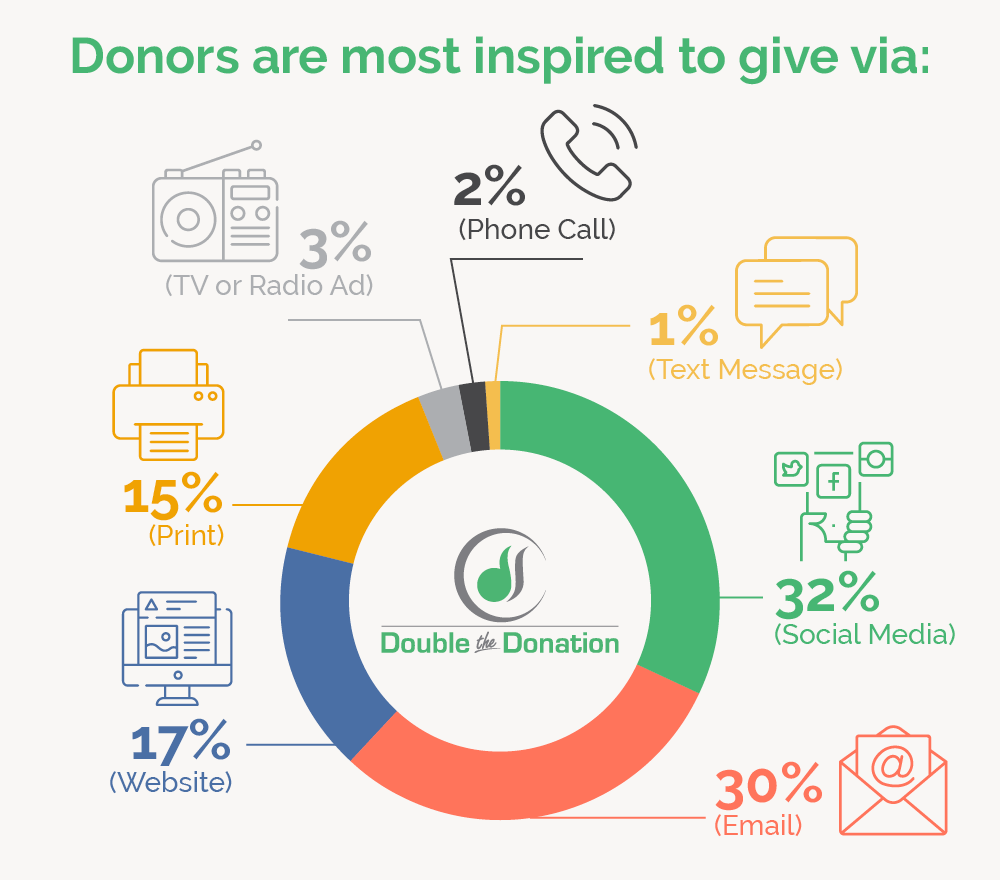
- 32% of donors are most inspired to give via social media, followed closely by email (30%), website (17%), print (15%), TV or radio ad (3%), phone call (2%), and text message (1%).
- Of those inspired to give via social media, 56% were most impacted by Facebook posts, 21% by Instagram, 13% by Twitter, 5% by YouTube, and 4% by LinkedIn.
- 48% of donors say that regular email communications are most likely to keep them engaged and inspire repeat donations, followed by social media communication (18%), print communication (16%), handwritten notes (12%), and phone calls (6%).
- 94% of donors say that nonprofits effectively express gratitude for their donations, while 93% believe organizations keep them updated on their programs.
- For every 1,000 email addresses, the average organization has 685 Facebook fans, 208 Twitter followers, and 160 Instagram followers.
- For nonprofits, return on ad spend was highest for search ads, at $2.75 for every dollar spent. Return on ad spend for display was $0.33, $0.50 for Meta, and $0.41 for Twitter.
- Segmenting your digital campaigns produces revenue growth of up to 760% compared to non-segmented campaigns.
Email Fundraising Statistics:
- Nonprofits send an average of 60 email messages per subscriber, including 29 fundraising appeals.
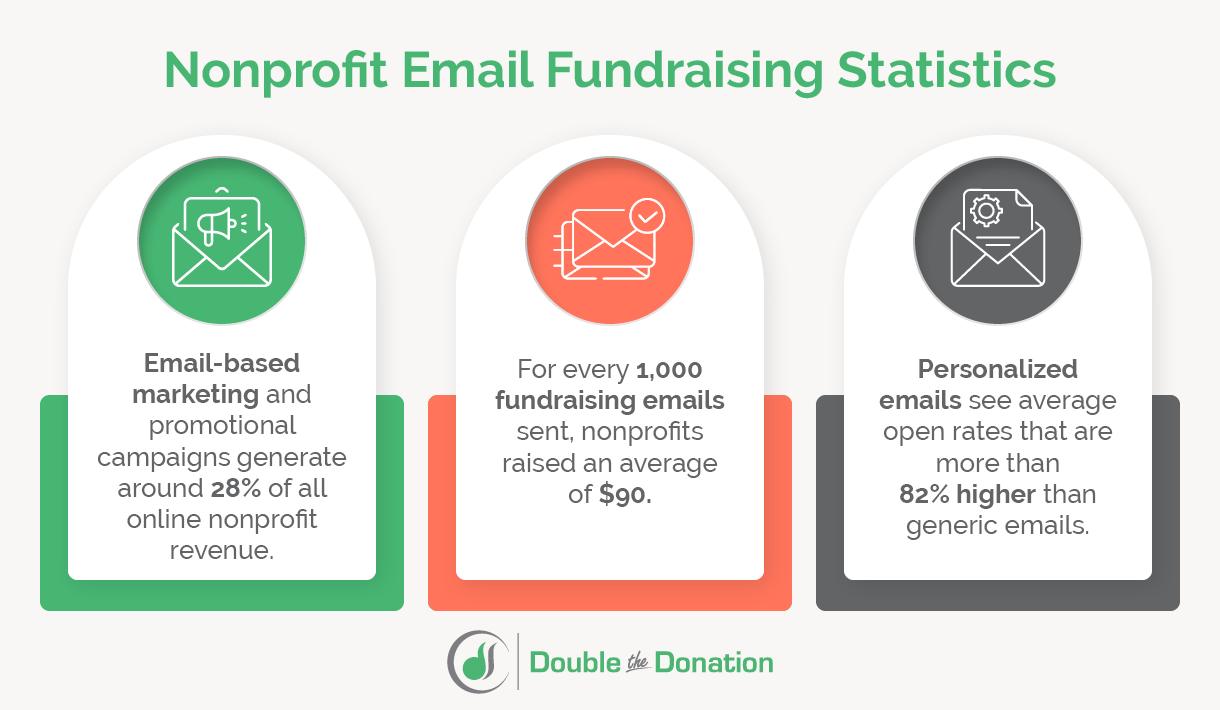
- Email-based marketing and promotional campaigns generate approximately 28% of all online nonprofit revenue.
- Nonprofits send an average of three email newsletters and two donation appeals monthly.
- For every 1,000 fundraising emails sent, nonprofits raised an average of $90.
- Personalized emails see average open rates that are more than 82% higher than generic emails.
- 55% of US donors prefer to be thanked for their charitable giving via email.
The Takeaway: Digital marketing for nonprofits has its high points and challenges. Content marketing, mainly through blogging and social media posts, represents an important opportunity for organizations to engage with their communities and grow their online visibility. Email, while still an effective and central digital marketing channel, requires a more effective strategy to yield fundraising results. Carefully track your email campaigns to determine the most viable techniques that interest your donors, and avoid approaches that generate high bounce rates or no engagement at all.
Fundraising Statistics:
Nonprofit Events & Peer-to-Peer Engagement
- 81% of U.S. donors indicate that they regularly attend nonprofit fundraising events.
- 21.9% of nonprofits say they receive corporate matches in their P2P fundraising, but don’t intentionally seek them out.
- Only 16.7% of nonprofits say they proactively train P2P participants to ask their donors for matches by providing helpful scripts and toolkits.
- 20% of surveyed nonprofits say providing prewritten email templates is an effective way to educate individual or P2P fundraisers.
- 55.6% of nonprofit professionals say high-impact storytelling in event emails is the peer-to-peer marketing tactic that drives the highest conversion rate for their organization.
- 27.7% of organizations say they ‘sometimes’ include matching gift prompts in outreach for special events.
The Takeaway: Event-based and peer-to-peer fundraising campaigns drive massive community engagement. Yet, most organizations leave significant revenue behind by treating workplace giving as an afterthought.
By combining participant enablement tools (like pre-written email templates) with back-end automation like Double the Donation Matching, development teams remove manual drudgery while ensuring every P2P gift is screened for match opportunities.
Fundraising Statistics:
Challenge Grants, Challenge Matches, and Matching Challenges
- 100% of nonprofits surveyed reported that challenge matches and grants increased campaign revenue.
- The presence of a challenge match increases dollars raised per solicitation by ~19% compared to fundraising appeals without a match.
- 58% of surveyed nonprofits say email campaigns are their primary channel for promoting challenge grants and matches.
- 43.8% of nonprofit professionals say they usually run a challenge match campaign ‘whenever a partner offers a match.’
- 27.3% of nonprofit professionals say they’ve never run a challenge match campaign but are looking for a partner to help them start one.
- Only 16% of surveyed nonprofits report promoting challenge grants on their website.
- 64% of surveyed organizations say they regularly conduct year-end challenge match campaigns.
- 45.5% of nonprofits stated that they typically ask a business they already work with when seeking a sponsor for a challenge match.
- 38.9% of nonprofit professionals say they applied for more than 10 grants in 2025.
The Takeaway: Donation matching is not exclusive to corporate giving programs! Securing support from a major donor interested in organizing a challenge match can go a long way toward increasing campaign results and deepening supporter engagement.
Fundraising Statistics:
The Financial Value of Volunteerism for Nonprofits
- 85% of financial donors across the United States also volunteer their time.
- Volunteers in America contribute an estimated 4.1 billion hours of their time, with an economic value of $122.9 billion.
- The value of one volunteer hour is currently estimated to be $36.14.
- 76% of survey respondents donate to the nonprofits they volunteer with, while 68% of survey respondents volunteer with the organizations they donate to.
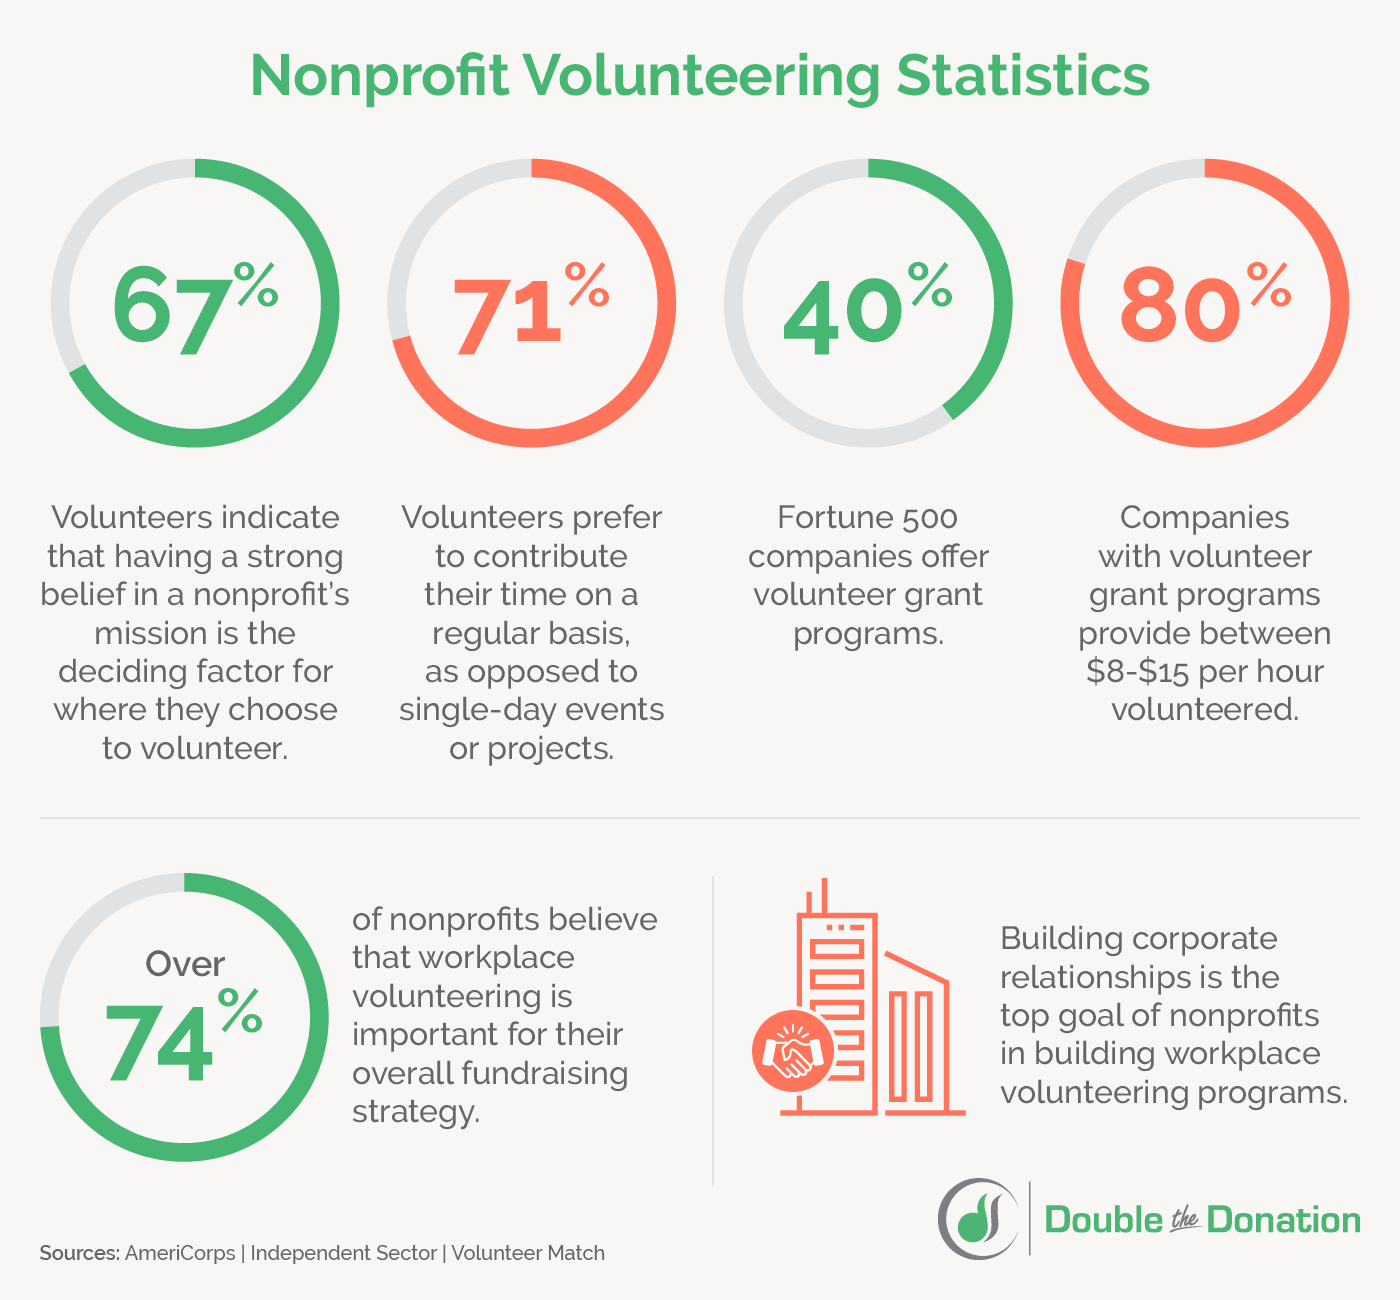
- 67% of volunteers indicate that having a strong belief in a nonprofit’s mission is the deciding factor for where they choose to volunteer.
- 71% of volunteers prefer to serve on a regular basis, as opposed to participating in single-day events or one-off projects.
- Over 74% of nonprofits believe that workplace volunteering is important for their overall fundraising strategy.
- 40% of Fortune 500 companies offer volunteer grant programs, with 80% of participating employers providing between $8 and $15 per hour for volunteer time.
- More than 60% of nonprofits view volunteering as a strategic revenue driver.
- Nearly 50% of nonprofits reported that their volunteers contribute 500+ hours each year.
- 30% of nonprofits have reported that interest in corporate volunteering has increased significantly over the last year.
The Takeaway: Volunteers remain crucial contributors to a nonprofit’s fundraising success, with many contributing both their time and money toward causes they care about. To retain their high-value support, nonprofits must take the time to express appreciation and emphasize their impact on the community. When people choose to volunteer with an organization, they’re often invested in the nonprofit for the long run, making it all the more important to recruit and cultivate strong relationships with nonprofit volunteers.
Wrapping Up & Additional Reading
The data paints a clear picture: modern supporters are eager to amplify their contributions, but awareness and execution gaps continue to hold back fundraising potential.
As total giving continues to grow across the nonprofit sector, organizations like yours cannot afford to leave matching gifts, volunteer grants, or recurring payroll contributions unclaimed. Closing these gaps effectively requires a move away from manual efforts and toward proactive, multi-channel strategies that engage donors at every step of their journey.
Looking to scale your overall fundraising? Check out this episode of our podcast, The Nonprofit Boost, to learn how your team can stay ahead of shifting trends:
How We Sourced These Fundraising Statistics
The Double the Donation team consulted various resources to compile this fundraising research:
- Corporate Giving and Matching Gift Statistics
- NPT Charitable Giving Statistics
- M+R Benchmark Report
- Nonprofit Communications Trends Report
- Giving USA Report on Philanthropy
- Blackbaud Trends in Giving Report
- Global Trends in Giving Report
- Volunteering and Civic Life in America
- Value of Volunteer Time
- How We Connect
- Fundraising Effectiveness Project Database
- Nonprofit Corporate Engagement Report 2026
- Arizona State University Donor Retention Statistics
- Corporate Volunteer Procurement Report